The past year has seen one of the greatest transfers of wealth in history. Around the world, as more and more working-class people slip into debt, or are facing eviction, or have burned through their savings to stay afloat during the pandemic, the world’s ~3,000 billionaires are billions richer. By The Decolonial Atlas.
Wealth inequality permeates every aspect of life in late-capitalism. Though it’s easily perceptible, quantifying inequality remains complicated. Some metrics, such as the GINI index, capture the distribution of income in an economy. But, as we’ve seen with the rise of billionaire fortunes this year, the capitalist class doesn’t rely on income for their fortunes. None of those people worked billionaire of times harder than they did the previous year. Their power comes from what they own, not what they produce. And so the most revealing measures of inequality are those examining the inequality of wealth – the value of one’s assets and possessions – rather than income. Here, we explore a few of those metrics.
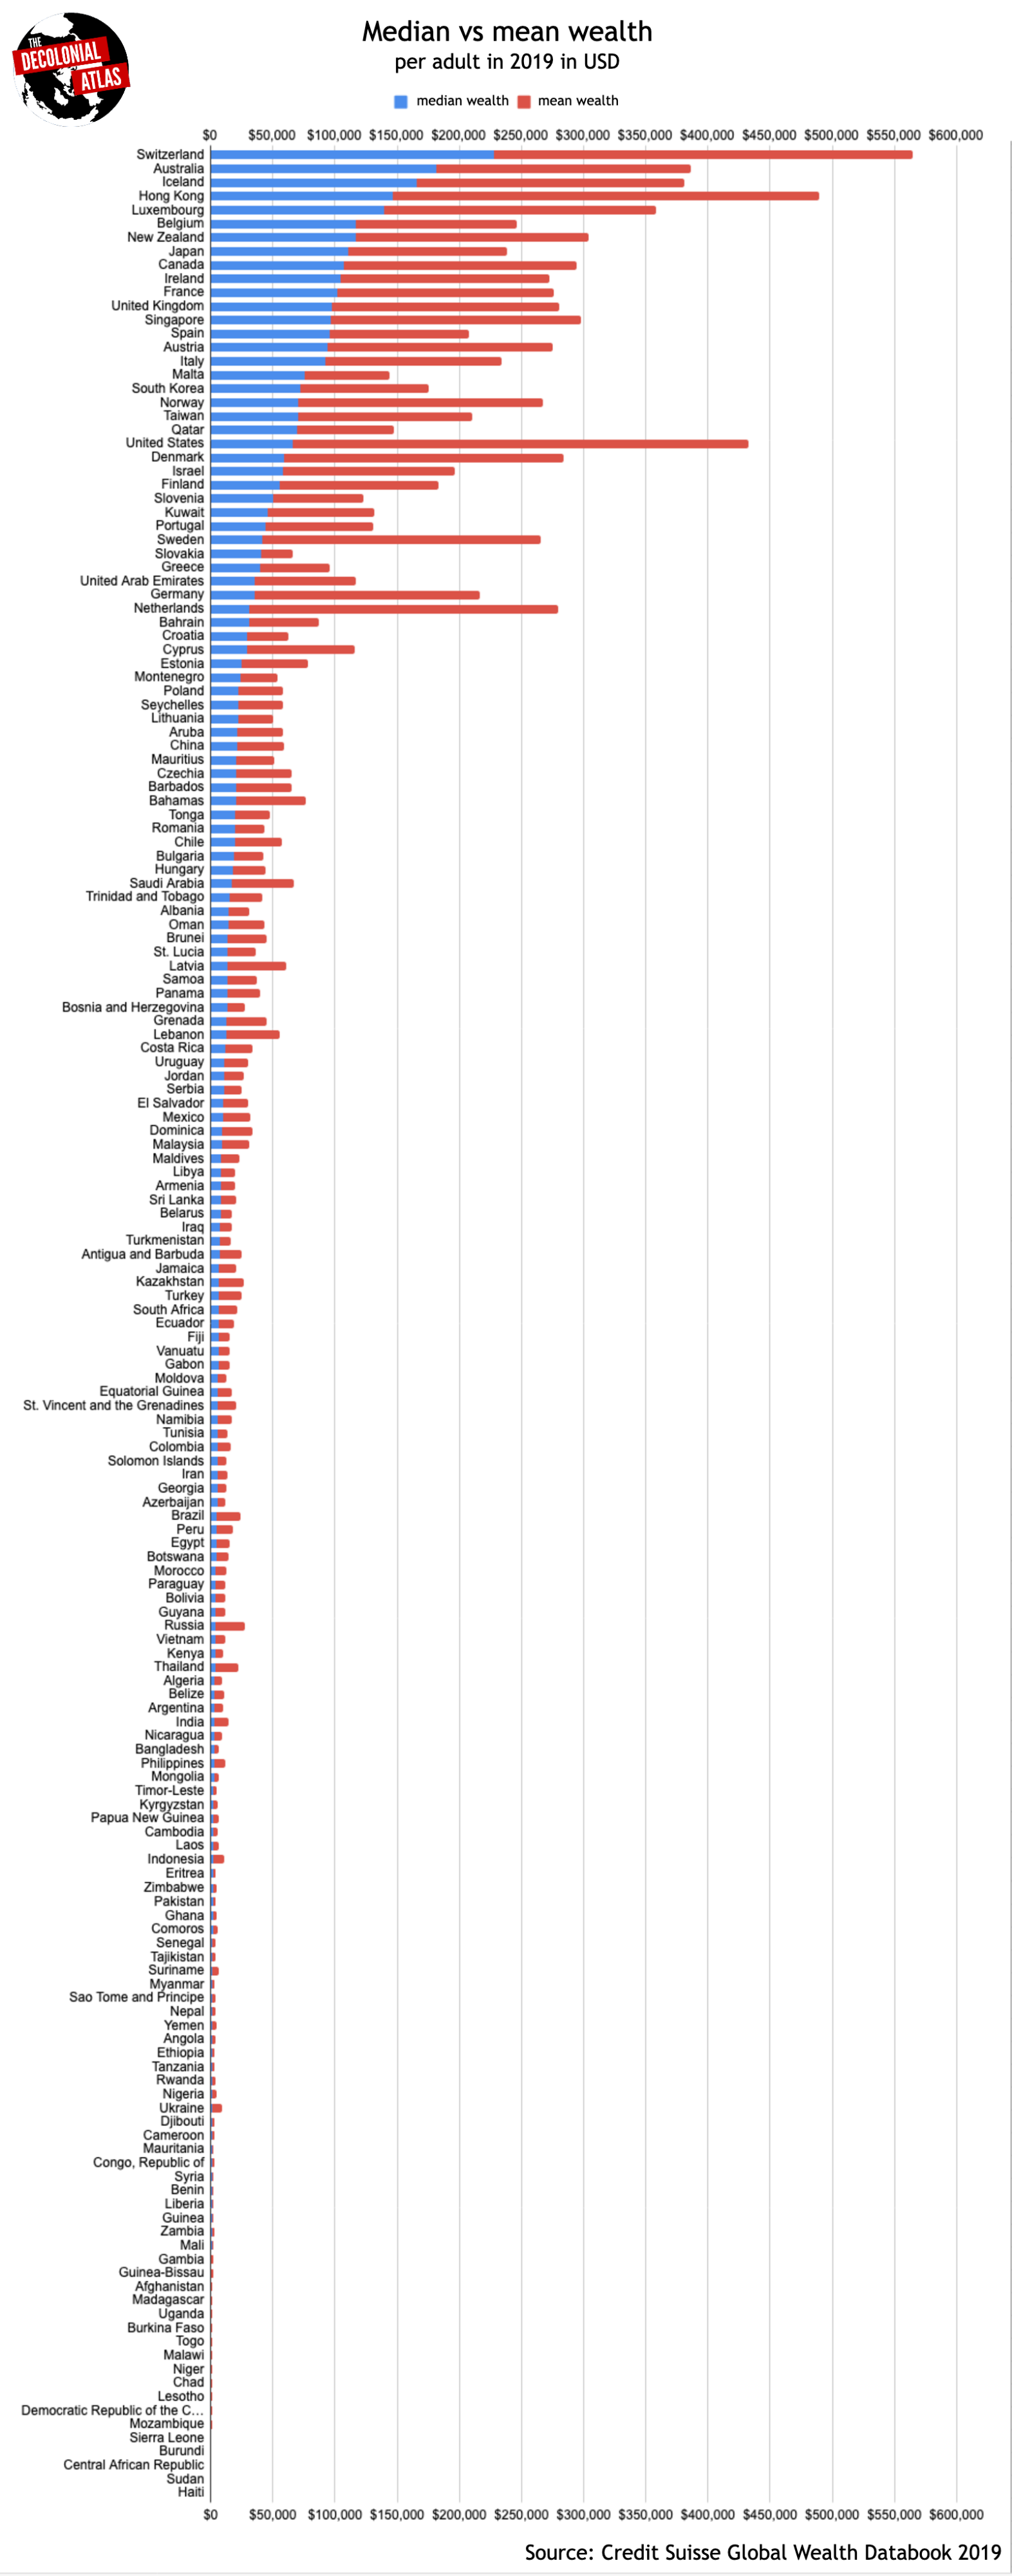
1. Median vs. mean wealth. Chart: Jordan Engel
Economists rely of several metrics to compare countries’ economic well-being including GDP per capita, “average” wealth, and “average” income. The problem with these measurements is that they fail to account for the gap between the rich and everyone else. That’s especially amiss now at a time when that gap is rapidly growing in many countries.
Mean wealth is a measurement of how much each person would have if wealth was distributed equally, while median wealth measures how much a typical person actually owns. Countries with the greatest wealth inequality have a wide gap between median and mean wealth. By this measure, the five most unequal countries are the Netherlands, Russia, Ukraine, United States, and Sweden – all of which have a mean wealth that is more than 5 times greater than the median. A typical American would be 6 times wealthier if wealth in the U.S. were distributed equally. The United States ranks third in mean wealth, but falls behind 21 countries when it comes to median wealth. While Japan is one of the world’s most equitable countries, even there a typical Japanese person would be twice as wealthy if the country’s wealth were distributed equally. Malta has the highest median wealth of any country without a billionaire. It also boasts one of the smallest median-to-mean individual wealth ratios of any country, second only to Slovakia.
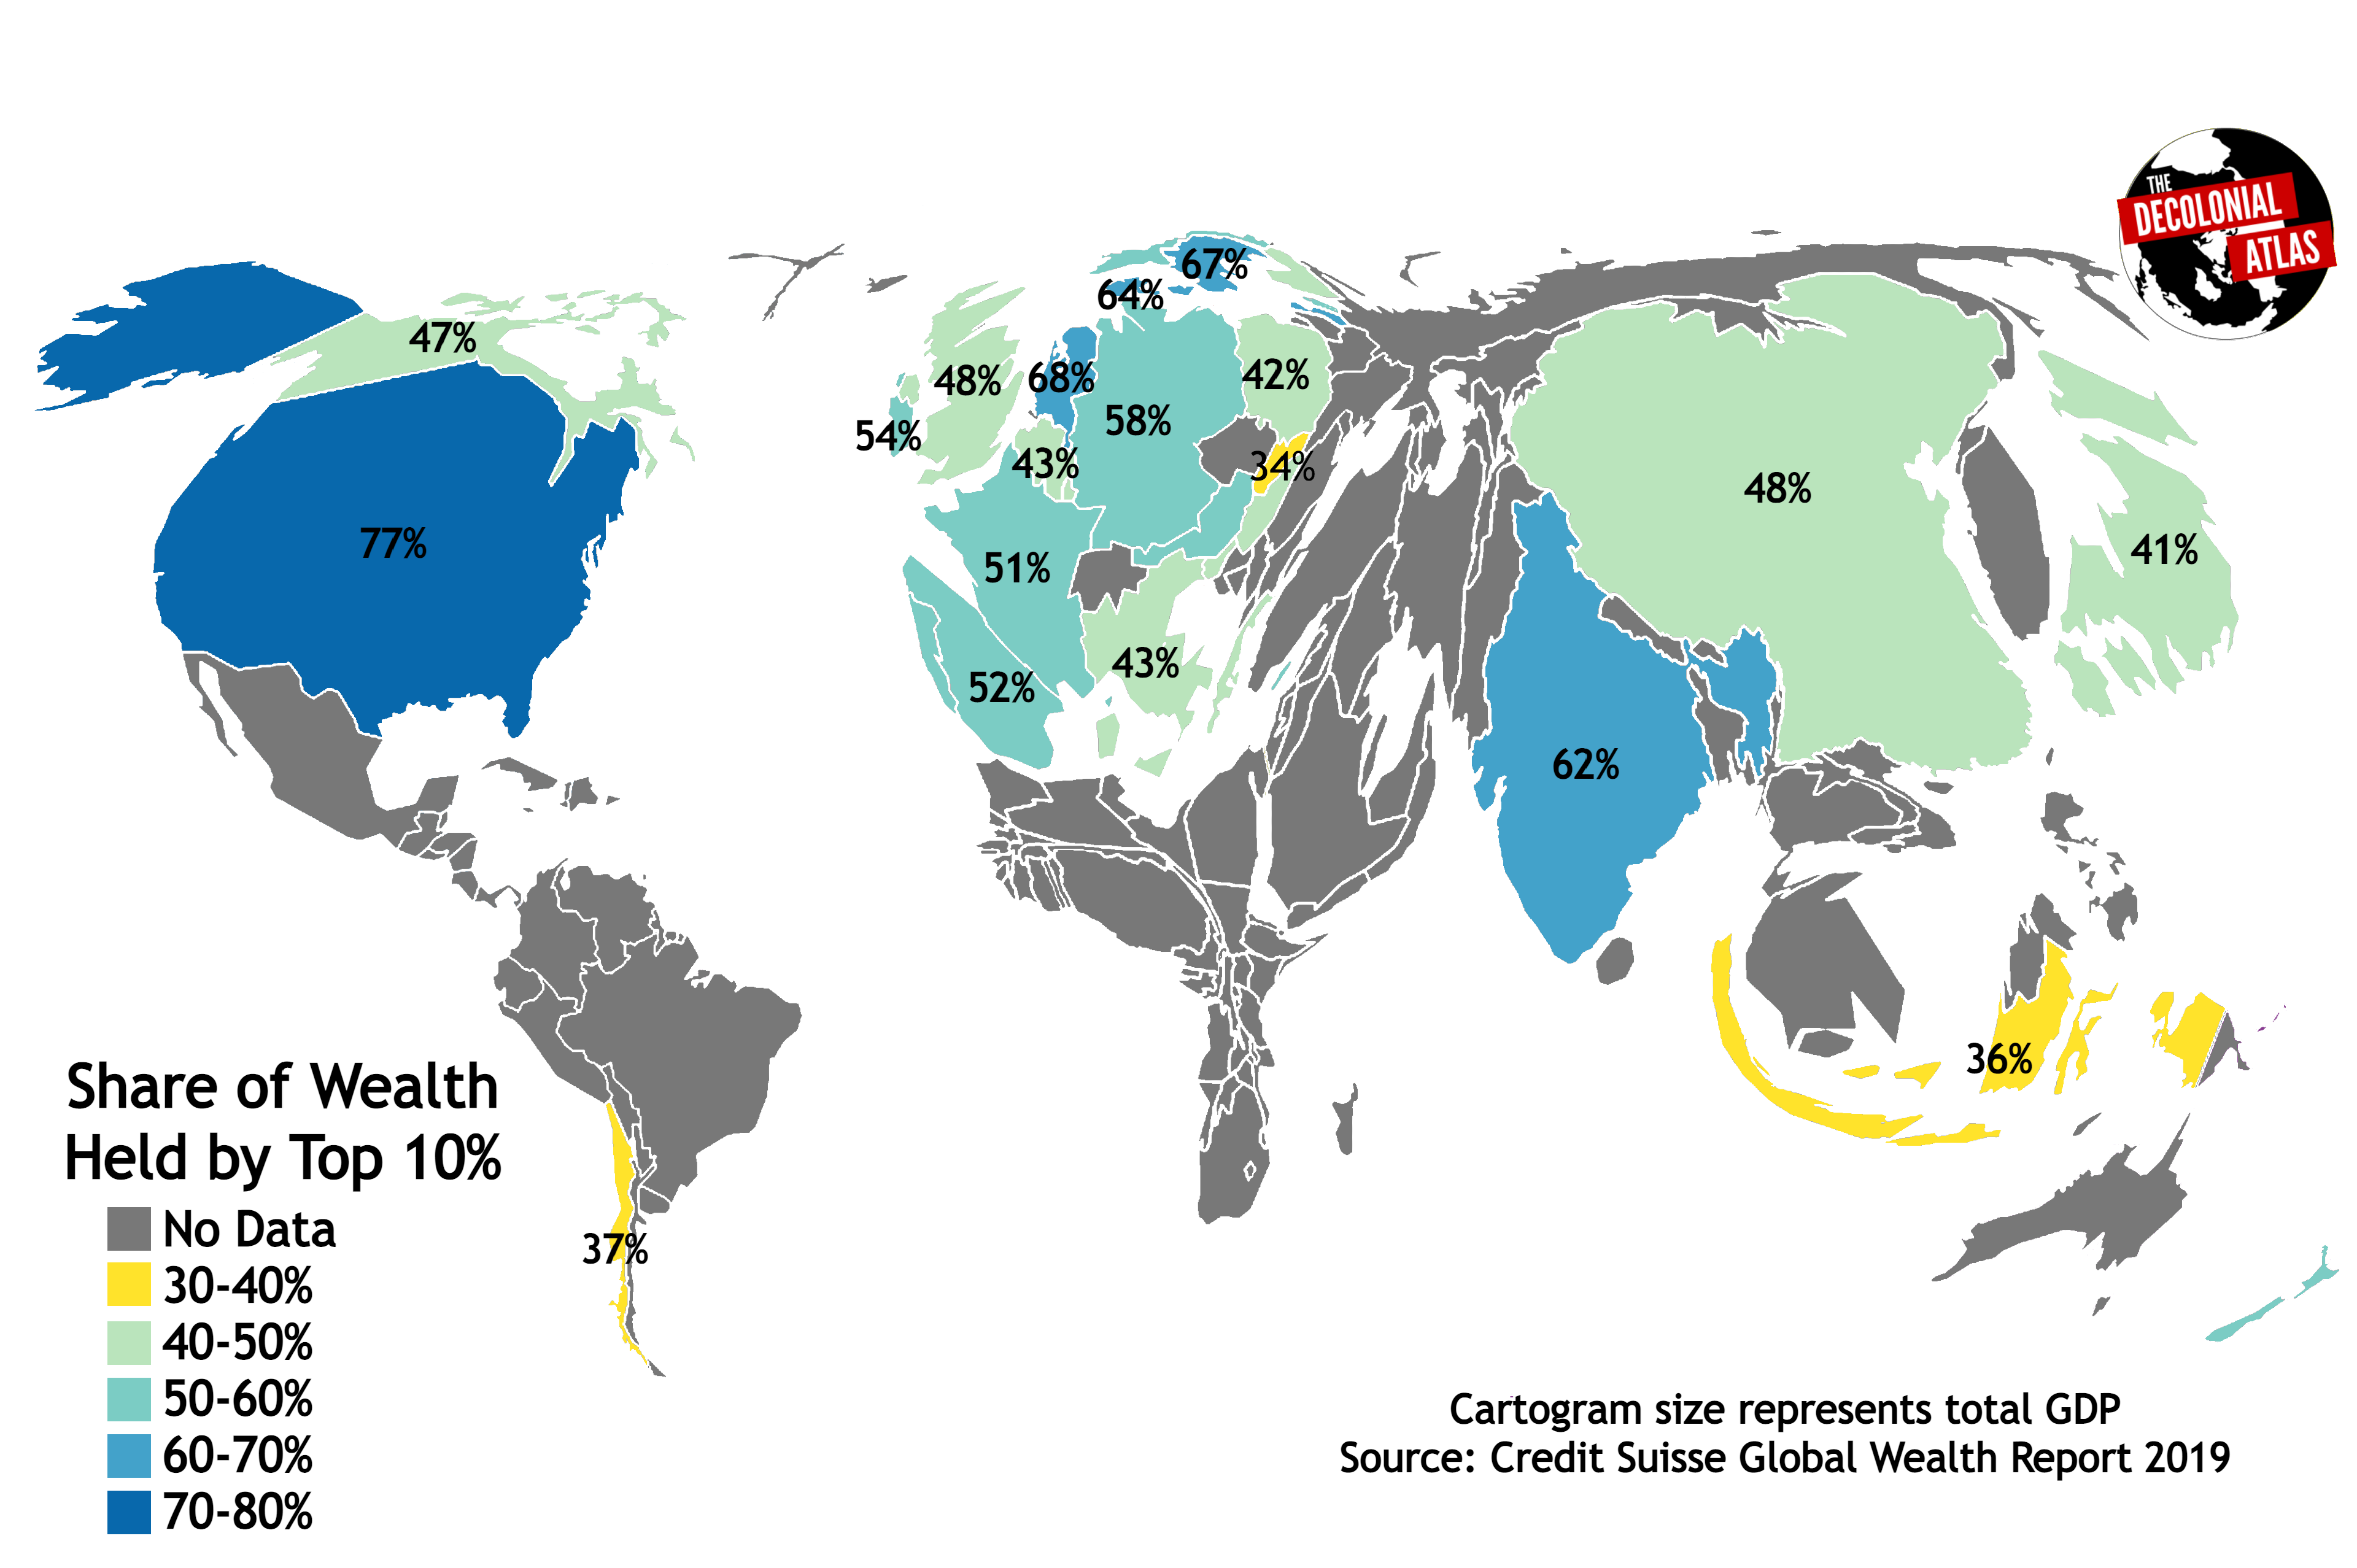
2. Share of wealth owned by the richest ten percent. Map: Jordan Engel
This metric is pretty intuitive, which makes it a good one for communicating the issue. Whether it’s the 1% or the 10%, people tend to understand that our societal wealth shouldn’t be concentrated in the hands of so few. The limit of this metric is that it’s lacking data for most countries. Of the countries we do have data for, the United States tops the list as the most unequal, with the top 10% owning 77% of the country’s wealth. Put another way, in the wealthiest country in the world, 90% of the people have access to only 23% of that wealth. Even less data is available for the share of each country’s wealth owned by the richest 1%, but the U.S. tops that list too, with the 1% controlling 39% of the wealth in 2016 (the latest year Credit Suisse has data for).
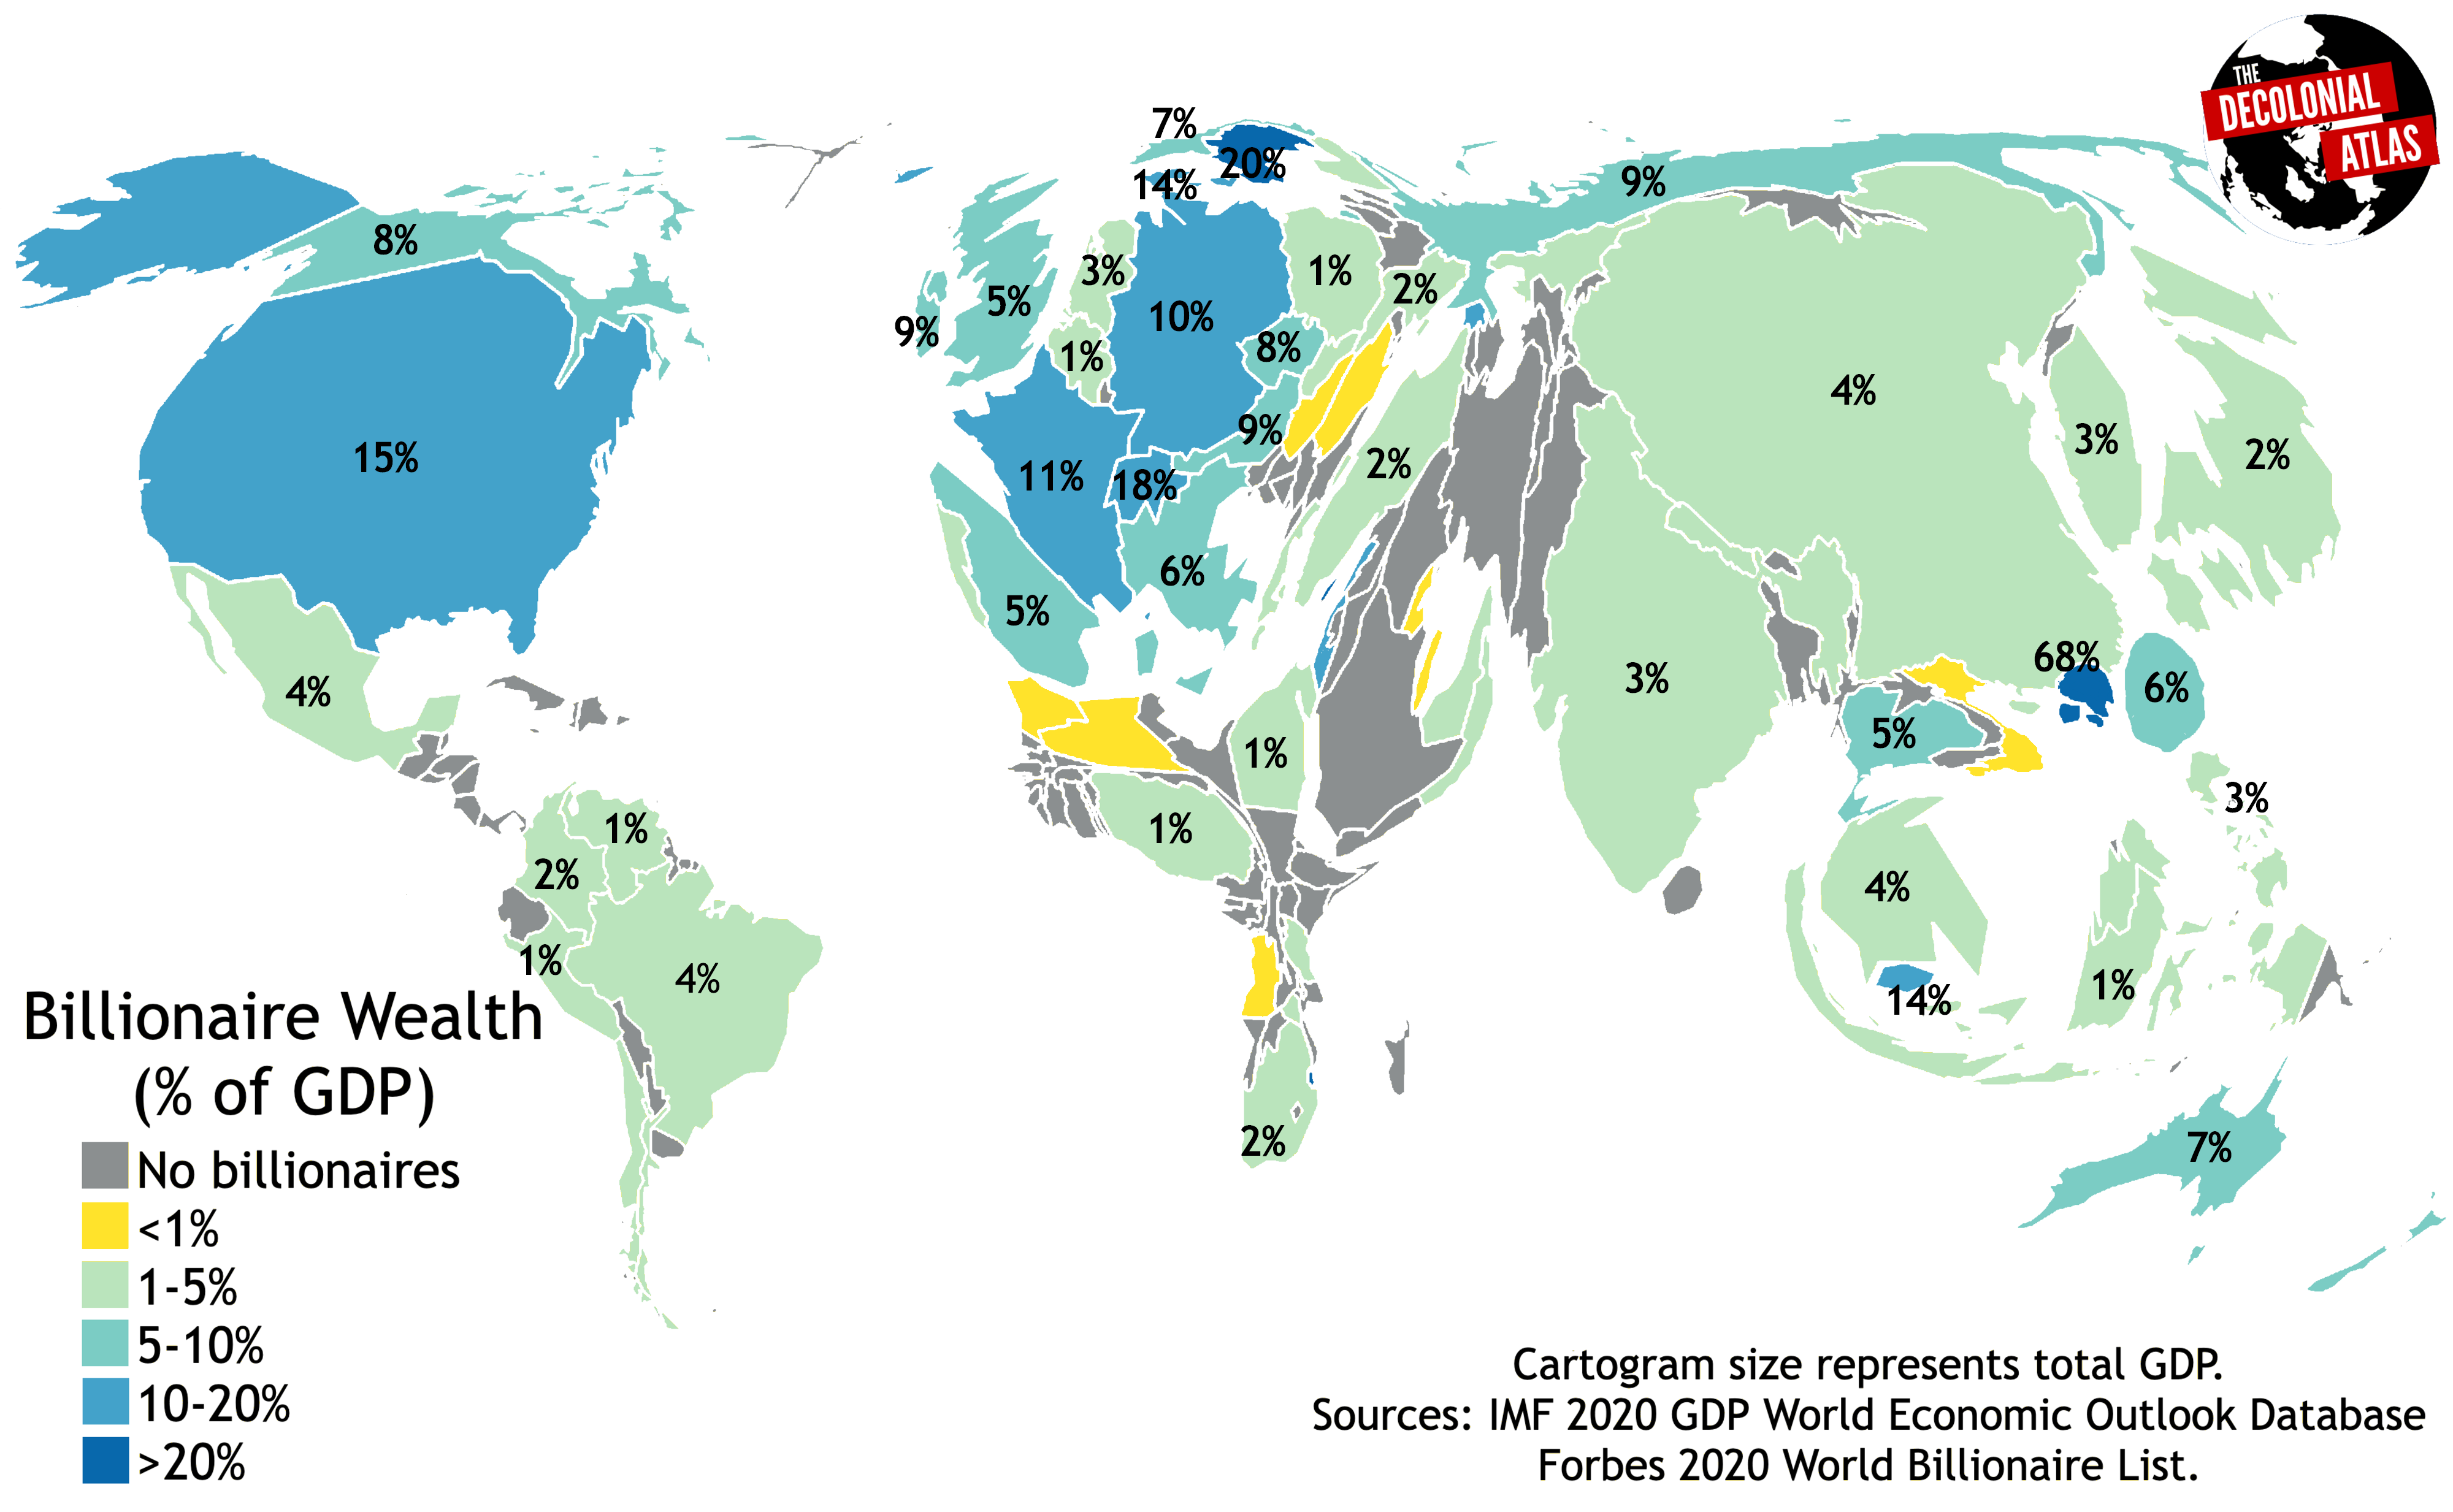
3. Billionaire wealth vs. GDP. Map: Jordan Engel
In this map, we explore how much wealth each country’s billionaire class holds compared to the country’s total GDP. GDP, of course, is the measure of the market value of all the final goods and services produced by workers. Billionaires do not produce anything. Their wealth comes not from paychecks for their labor, but from the theoretical value of the things they “own,” including the labor of “their” workers.
This map helps us to visualize the absurd wealth of the the billionaire class, and creates a new measure of wealth inequality. While countries don’t necessarily need to have a billionaire to experience wealth inequality, this metric provides a glimpse of where the world’s ultra-rich are, and compares their wealth to the societies that produced them. Note that this data does not account for the fact that the source of many billionaires’ wealth is abroad.
The world has produced less than 3,000 billionaires. Their total net worth is around $8 trillion. The US has the largest billionaire class, both in terms of numbers – 614 billionaires – and net worth – $3 trillion. The GDP of all countries combined is around $138 trillion. The billionaire class owns more wealth than the GDPs of 136 countries combined.
Further resources:
Washington Post
Credit Suisse Global Wealth Databook
Forbes 2020 World Billionaire List
International Monetary Fund 2020 World Economic Outlook Database
Original resource: The Decolonial Atlas
Decolonial Atlas maps can be reused under the Decolonial Media License 0.1.
Image credit: edupics
